How’s the real estate market?
Naturally, that’s the question I am frequently asked, and because I’m such a data nerd, I usually answer “it depends”.
I track data in 17 areas of 4 counties along Florida’s Emerald Coast, from Navarre to Panama City, by looking at every individual residential transaction since 2017. Not only are our markets different here than in the rest of the country, but they even differ by area. For example, the 30A West area of Walton County has almost 6 months of inventory, measured as the number of months it would take to sell all the homes currently listed if no new homes were added. In contrast, Niceville in Okaloosa County has 1.1 months of inventory.
I like the months of inventory measure, as it’s somewhat of a proxy for supply and demand, especially when compared to the same month over the past years. A “balanced” market usually has between 5 to 6 months of inventory. Less is considered a seller’s market, and more is considered a buyer’s market. None of the markets in the Emerald Coast areas I track are currently considered a “Buyer’s Market”.
The chart below shows all 17 areas combined and shows that the months of inventory levels for May 2023 were the second lowest in the past 7 years.

Figure 1- Months of Inventory
Buyers and Sellers tend to think of “good” markets in almost opposite terms. For example, sellers like markets where prices are rising, demand is high, and the number of homes for sale is low. Buyers usually like the opposite set of circumstances, with many looking for “a deal”. What’s clear to me across almost all our markets in the Emerald Coast is that prices are leveling off, and there are very few deals to be found.
Another good quantifier for evaluating a market is comparing the sold price against the original listing price (SP/OLP). I prefer to look at the original price, as agents can play games with the current asking price in order to make their stats look better.
A good rule of thumb in a balanced market in this area is that this figure would be near 96%. In other words, the average home sold for about 96% of what was originally being asked. The closer it gets to 100%, the buyer has less negotiating room. A lower percentage might indicate that the seller’s or their agent originally thought their homes were worth more than market conditions would suggest.
The chart below shows how the range has changed since 2017. The current percentage is less than the peak years of 2021/2022, but in the same region as other years.
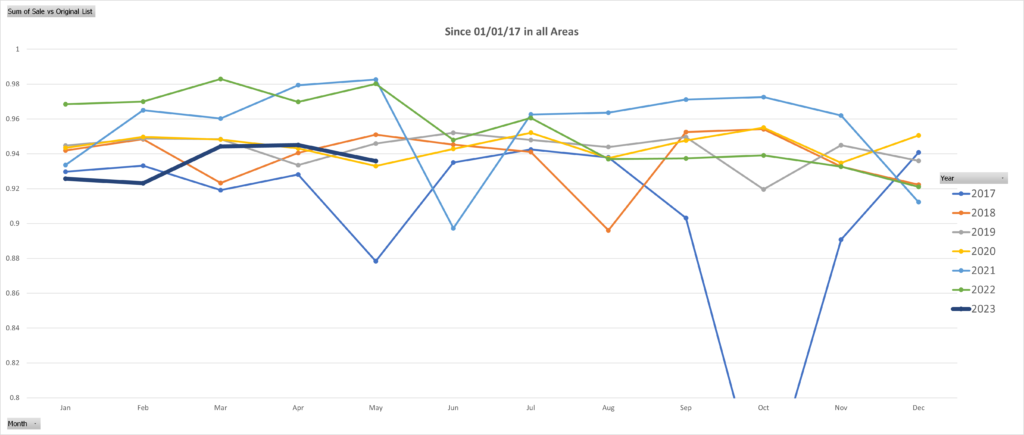
Figure 2- Sale Price / Original List Price
Looking at individual areas, Niceville still has a strong market, with SP/OLP of 97.7%, while North Santa Rosa Beach, and Point Washington, are overpriced at 87%
Finally, what about price? Are prices about to fall, and should buyers wait? The answer to this question is very dependent on a number of factors, too lengthy for this post, but looking at trends is a good way to start considering the answer. The chart below maps the median sales price across the region since 2017.
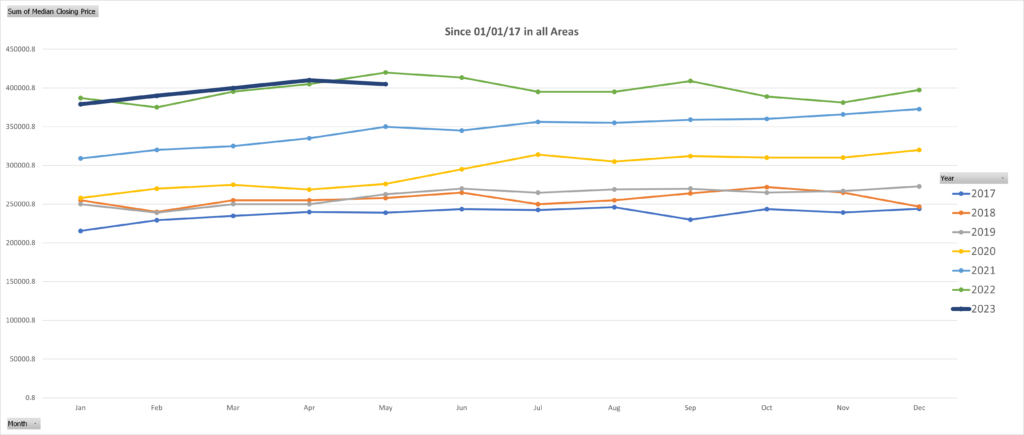
Figure 3- Median Sales Price
Prices did begin to adjust downward from their highs in Fall 2022 but began to rise again in December. Prices are significantly above 2017-2021, and so far, show no indication of falling below those levels. The data does not appear to suggest that waiting will result in a preferred outcome.
So, how’s the market? It’s less frantic than it was in 2021 and 2022 and about the same or better than the years before that. It is neither crashing nor in a panic selloff. The best answer, though, is it really depends on what you’re looking to accomplish.
If you’re thinking of either buying or selling, I’d be happy to earn your business by sharing the important trends in your area. Contact me to find out more.